What patterns appear across manufacturing logos?
Logo Index analyzed 952 identities categorized under Manufacturing to look for recurring visual structures, geographic concentrations and color patterns across the archive.
The strongest recurring visual feature is the use of letter-based marks, recorded in 458 entries, or 48.1% of the dataset. Lines appear in 314 identities, circles in 238, squares in 121 and triangles in 59. The archive is also geographically broad: the United States accounts for the largest share of records, followed by Germany, Switzerland, Japan and Italy.
Color data is considerably less complete than the other fields, so color findings are treated as a secondary result rather than the main conclusion of this study.
Dataset analyzed: 952 Manufacturing records · Analysis: September 2026
Key Findings
- Letters appear in 458 records, representing 48.1% of the Manufacturing archive.
- Lines appear in 314 records, or 33.0%.
- Circles appear in 238 records, or 25.0%.
- Squares appear in 121 records, or 12.7%.
- Triangles appear in 59 records, or 6.2%.
- The United States contributes 176 records, followed by Germany with 120 and Switzerland with 105.
- Year metadata is available for 72.0% of the dataset.
- Designer metadata is available for 64.4%.
- Color metadata is available for only 28.0%, so color results should be interpreted cautiously.
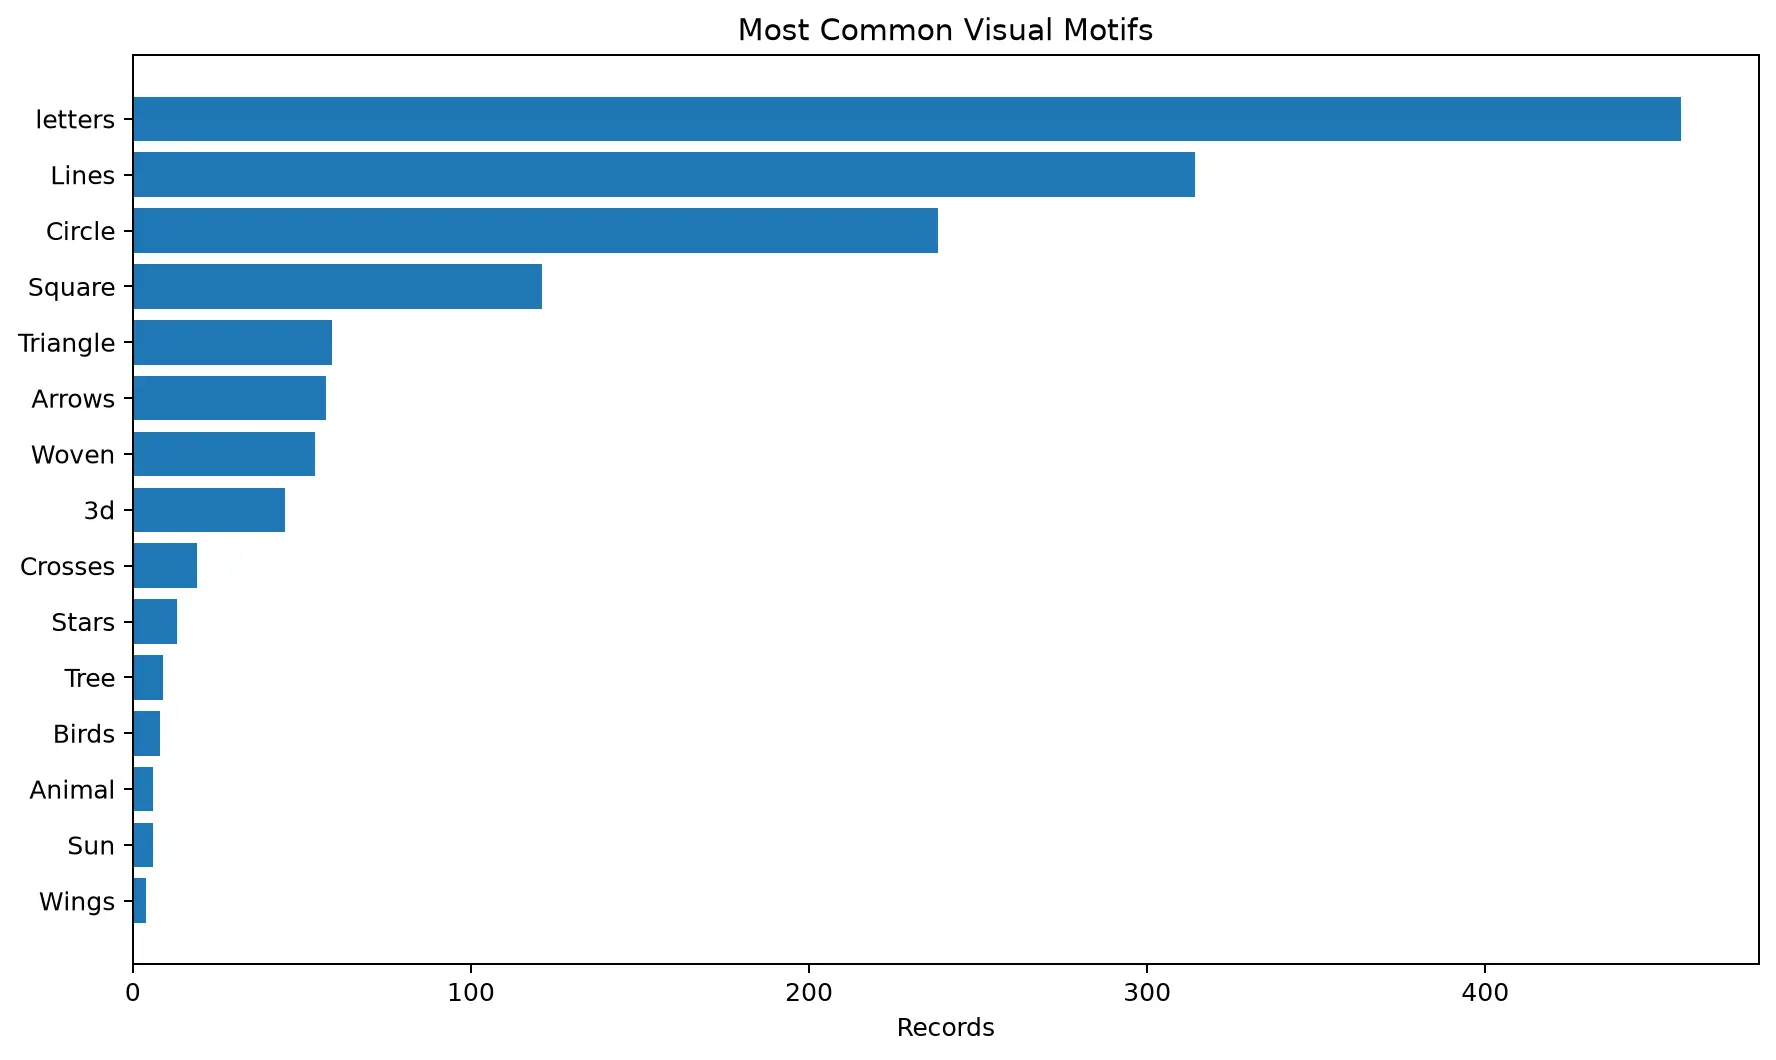
Figure 1. Most frequently recorded visual motifs and structural tags across the Logo Index Manufacturing archive.
The Most Common Visual Patterns in Manufacturing Logos
| Visual motif | Records | Share of dataset |
|---|---|---|
| Letters | 458 | 48.1% |
| Lines | 314 | 33.0% |
| Circle | 238 | 25.0% |
| Square | 121 | 12.7% |
| Triangle | 59 | 6.2% |
| Arrows | 57 | 6.0% |
| Woven forms | 54 | 5.7% |
| 3D forms | 45 | 4.7% |
The most notable finding is the prevalence of letter-based identities. Almost half of the Manufacturing records include the archive’s “letters” tag. This does not mean that half of all manufacturing logos are pure monograms: the tag can appear alongside other structural elements, such as circles, lines or geometric shapes.
Lines form the second-largest group, appearing in roughly one third of the dataset. Circles are also widespread, appearing in one quarter of the records. Squares and triangles are substantially less common but still visible across dozens of identities.
Because these classifications can overlap, the percentages should not be added together. A single identity can contain letters, lines and a circle at the same time.
Letters and Geometry Dominate the Archive
Taken together, the data shows a Manufacturing archive strongly oriented toward letterforms and simple geometric construction.
458 records contain letter-based elements, while hundreds also use lines, circles, squares or triangles. This is more informative than assigning symbolic meaning to those shapes. The dataset can establish that these structures recur frequently; it cannot establish why an individual company or designer selected them without brand-specific evidence.
The prominence of letters also makes sense as an archive-level observation because many manufacturing identities need to function as compact organizational marks, initials or abbreviated names. However, this dataset alone does not prove that functional requirement caused the design choices.
Where the Manufacturing Identities Come From
The Manufacturing archive is distributed across many countries, although several design markets account for a substantial share of the records.
| Country | Records | Share of dataset |
|---|---|---|
| United States | 176 | 18.5% |
| Germany | 120 | 12.6% |
| Switzerland | 105 | 11.0% |
| Japan | 86 | 9.0% |
| Italy | 81 | 8.5% |
| United Kingdom | 55 | 5.8% |
| Canada | 51 | 5.4% |
| France | 31 | 3.3% |
| Sweden | 24 | 2.5% |
| Finland | 17 | 1.8% |
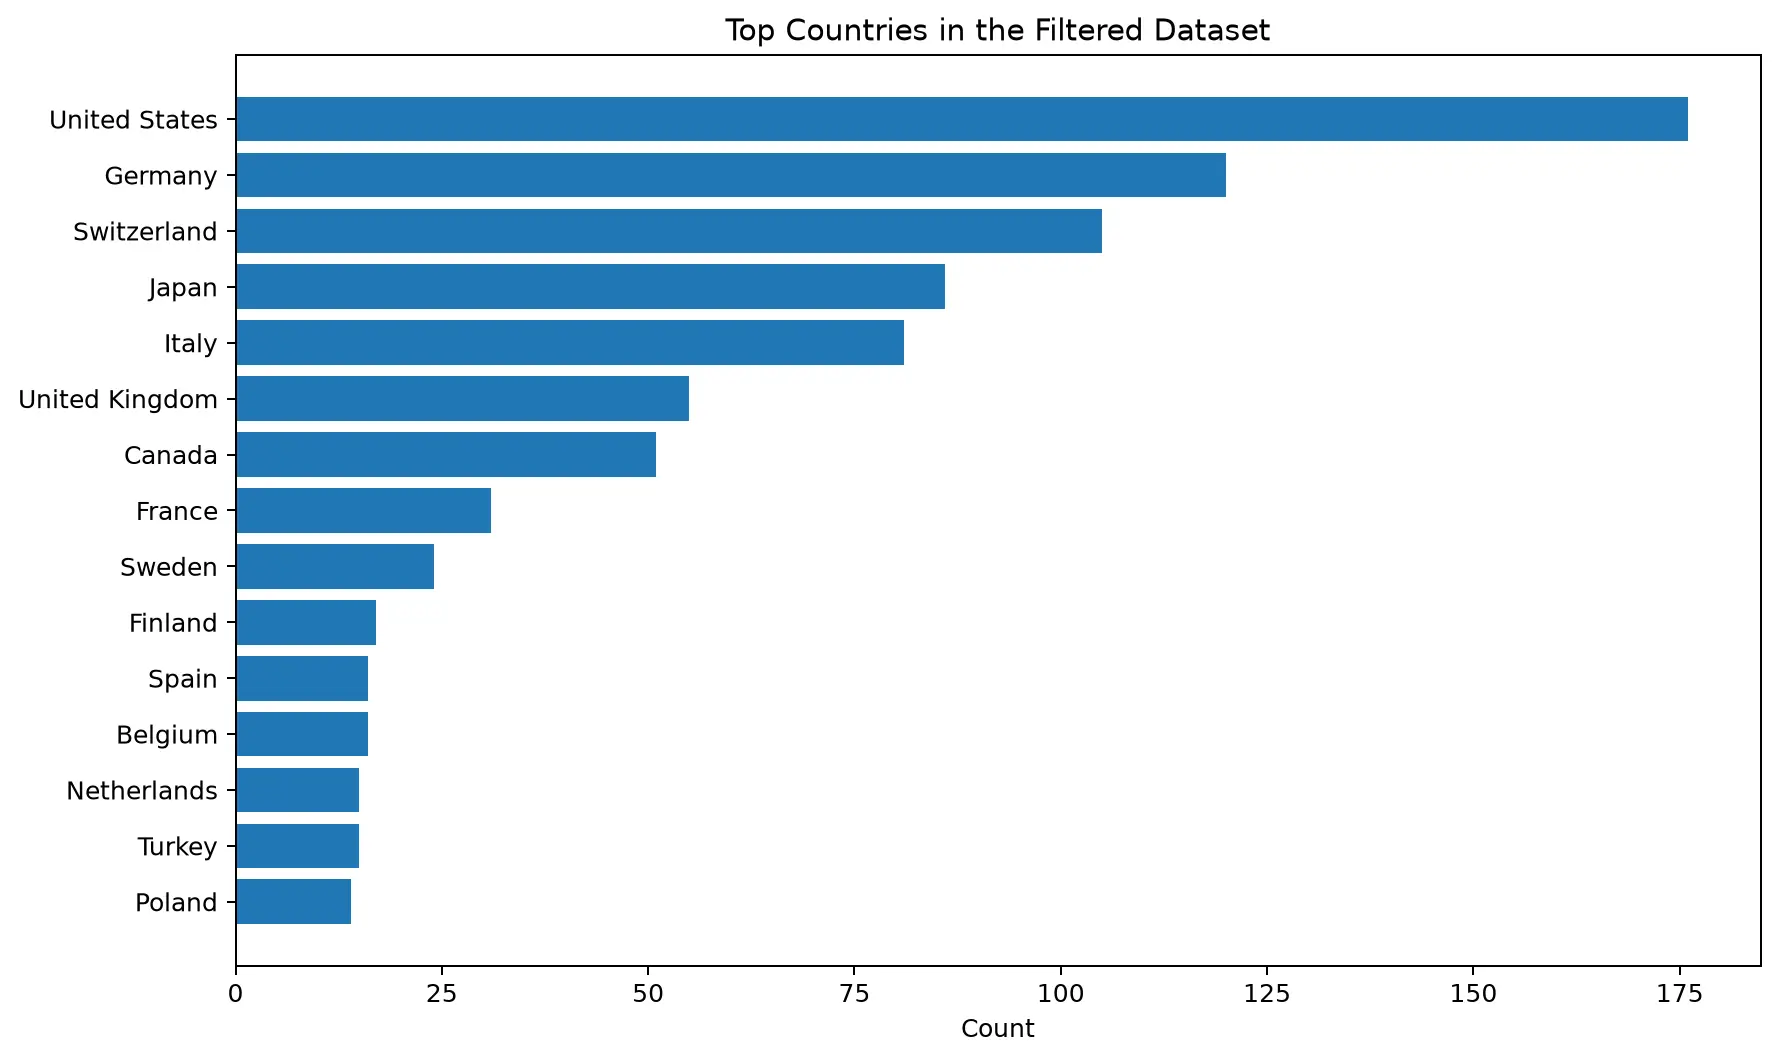
Figure 2. Countries with the largest representation in the filtered Manufacturing dataset.
The United States represents the largest individual group, with 176 records. Germany and Switzerland together contribute another 225 identities, while Japan and Italy add 167.
These figures describe the composition of the Logo Index archive. They should not be interpreted as a ranking of countries by manufacturing activity or as proof that those countries produce more logos than others.
Examples From the Manufacturing Archive
The examples below show how differently letterforms, circles, lines and geometric construction can appear within the same broad industry category.


What About Color?
Color produces interesting results, but it is the weakest major field in this particular dataset. Only 267 of 952 Manufacturing records contain usable color metadata, equivalent to 28.0% coverage.
Among those 267 records:
| Color family | Records | Share of usable color records |
|---|---|---|
| Blue | 109 | 40.8% |
| Red | 79 | 29.6% |
| Gray | 70 | 26.2% |
| Black | 57 | 21.3% |
| White | 37 | 13.9% |
| Orange | 32 | 12.0% |
Blue is the most frequently recorded family within this usable subset, followed by red and gray. Because fewer than one third of the full Manufacturing archive has structured color data, these figures should not be generalized to all 952 identities.
How Many Colors Are Recorded Per Identity?
Among the 267 records with usable color metadata, 153 entries, or 57.3%, contain only one normalized color family. Another 80 records, or 30.0%, contain two. Three-color palettes account for 20 records.
| Number of color families | Records | Share of usable color records |
|---|---|---|
| 1 | 153 | 57.3% |
| 2 | 80 | 30.0% |
| 3 | 20 | 7.5% |
| 4 | 8 | 3.0% |
| 5+ | 6 | 2.2% |
This result describes the recorded metadata rather than visual complexity. A logo assigned one broad color family can still contain complex shapes, typography or construction.
What the Data Can and Cannot Tell Us
This analysis can establish which countries, visual motifs and recorded color families occur most frequently inside the Logo Index Manufacturing archive.
It cannot establish why a particular designer used a circle, line, letterform or color without evidence from that identity’s documentation. For that reason, this report avoids assigning universal meanings such as “blue represents trust” or “circles symbolize unity.”
The archive also combines different types of organizations inside the broad Manufacturing category, including industrial, textile, engineering, printing and related identities. The results therefore describe the category as stored in Logo Index rather than a single manufacturing sub-sector.
Methodology
Logo Index filtered its database to 952 records categorized under Manufacturing. The analysis used structured metadata associated with those records, including country, year, designer, agency, color, tags and image URLs.
Dataset Coverage
| Field | Coverage |
|---|---|
| Industry | 100.0% |
| Tags | 100.0% |
| Image URL | 100.0% |
| Country | 99.5% |
| Year | 72.0% |
| Designer | 64.4% |
| Color | 28.0% |
| Agency | 15.0% |
| Styles | 0.4% |
The strong coverage of Country, Tags and Image URL makes those fields suitable for broad archive-level analysis. Year and Designer coverage is substantial but incomplete. Color and Agency are considerably weaker, while the Styles field is too sparse to support useful conclusions.
Limitations
- The Logo Index archive is not a statistically representative census of every manufacturing logo in existence.
- Tags can overlap, so one identity may belong to several visual-motif totals.
- The Manufacturing category contains multiple types of organizations and sub-industries.
- Color metadata is available for only 28.0% of the records.
- Year data is available for 72.0%, so historical conclusions require additional caution.
- Designer attribution is present for 64.4% of records and should not be treated as complete.
- Agency and Styles metadata are too sparse for broad conclusions.